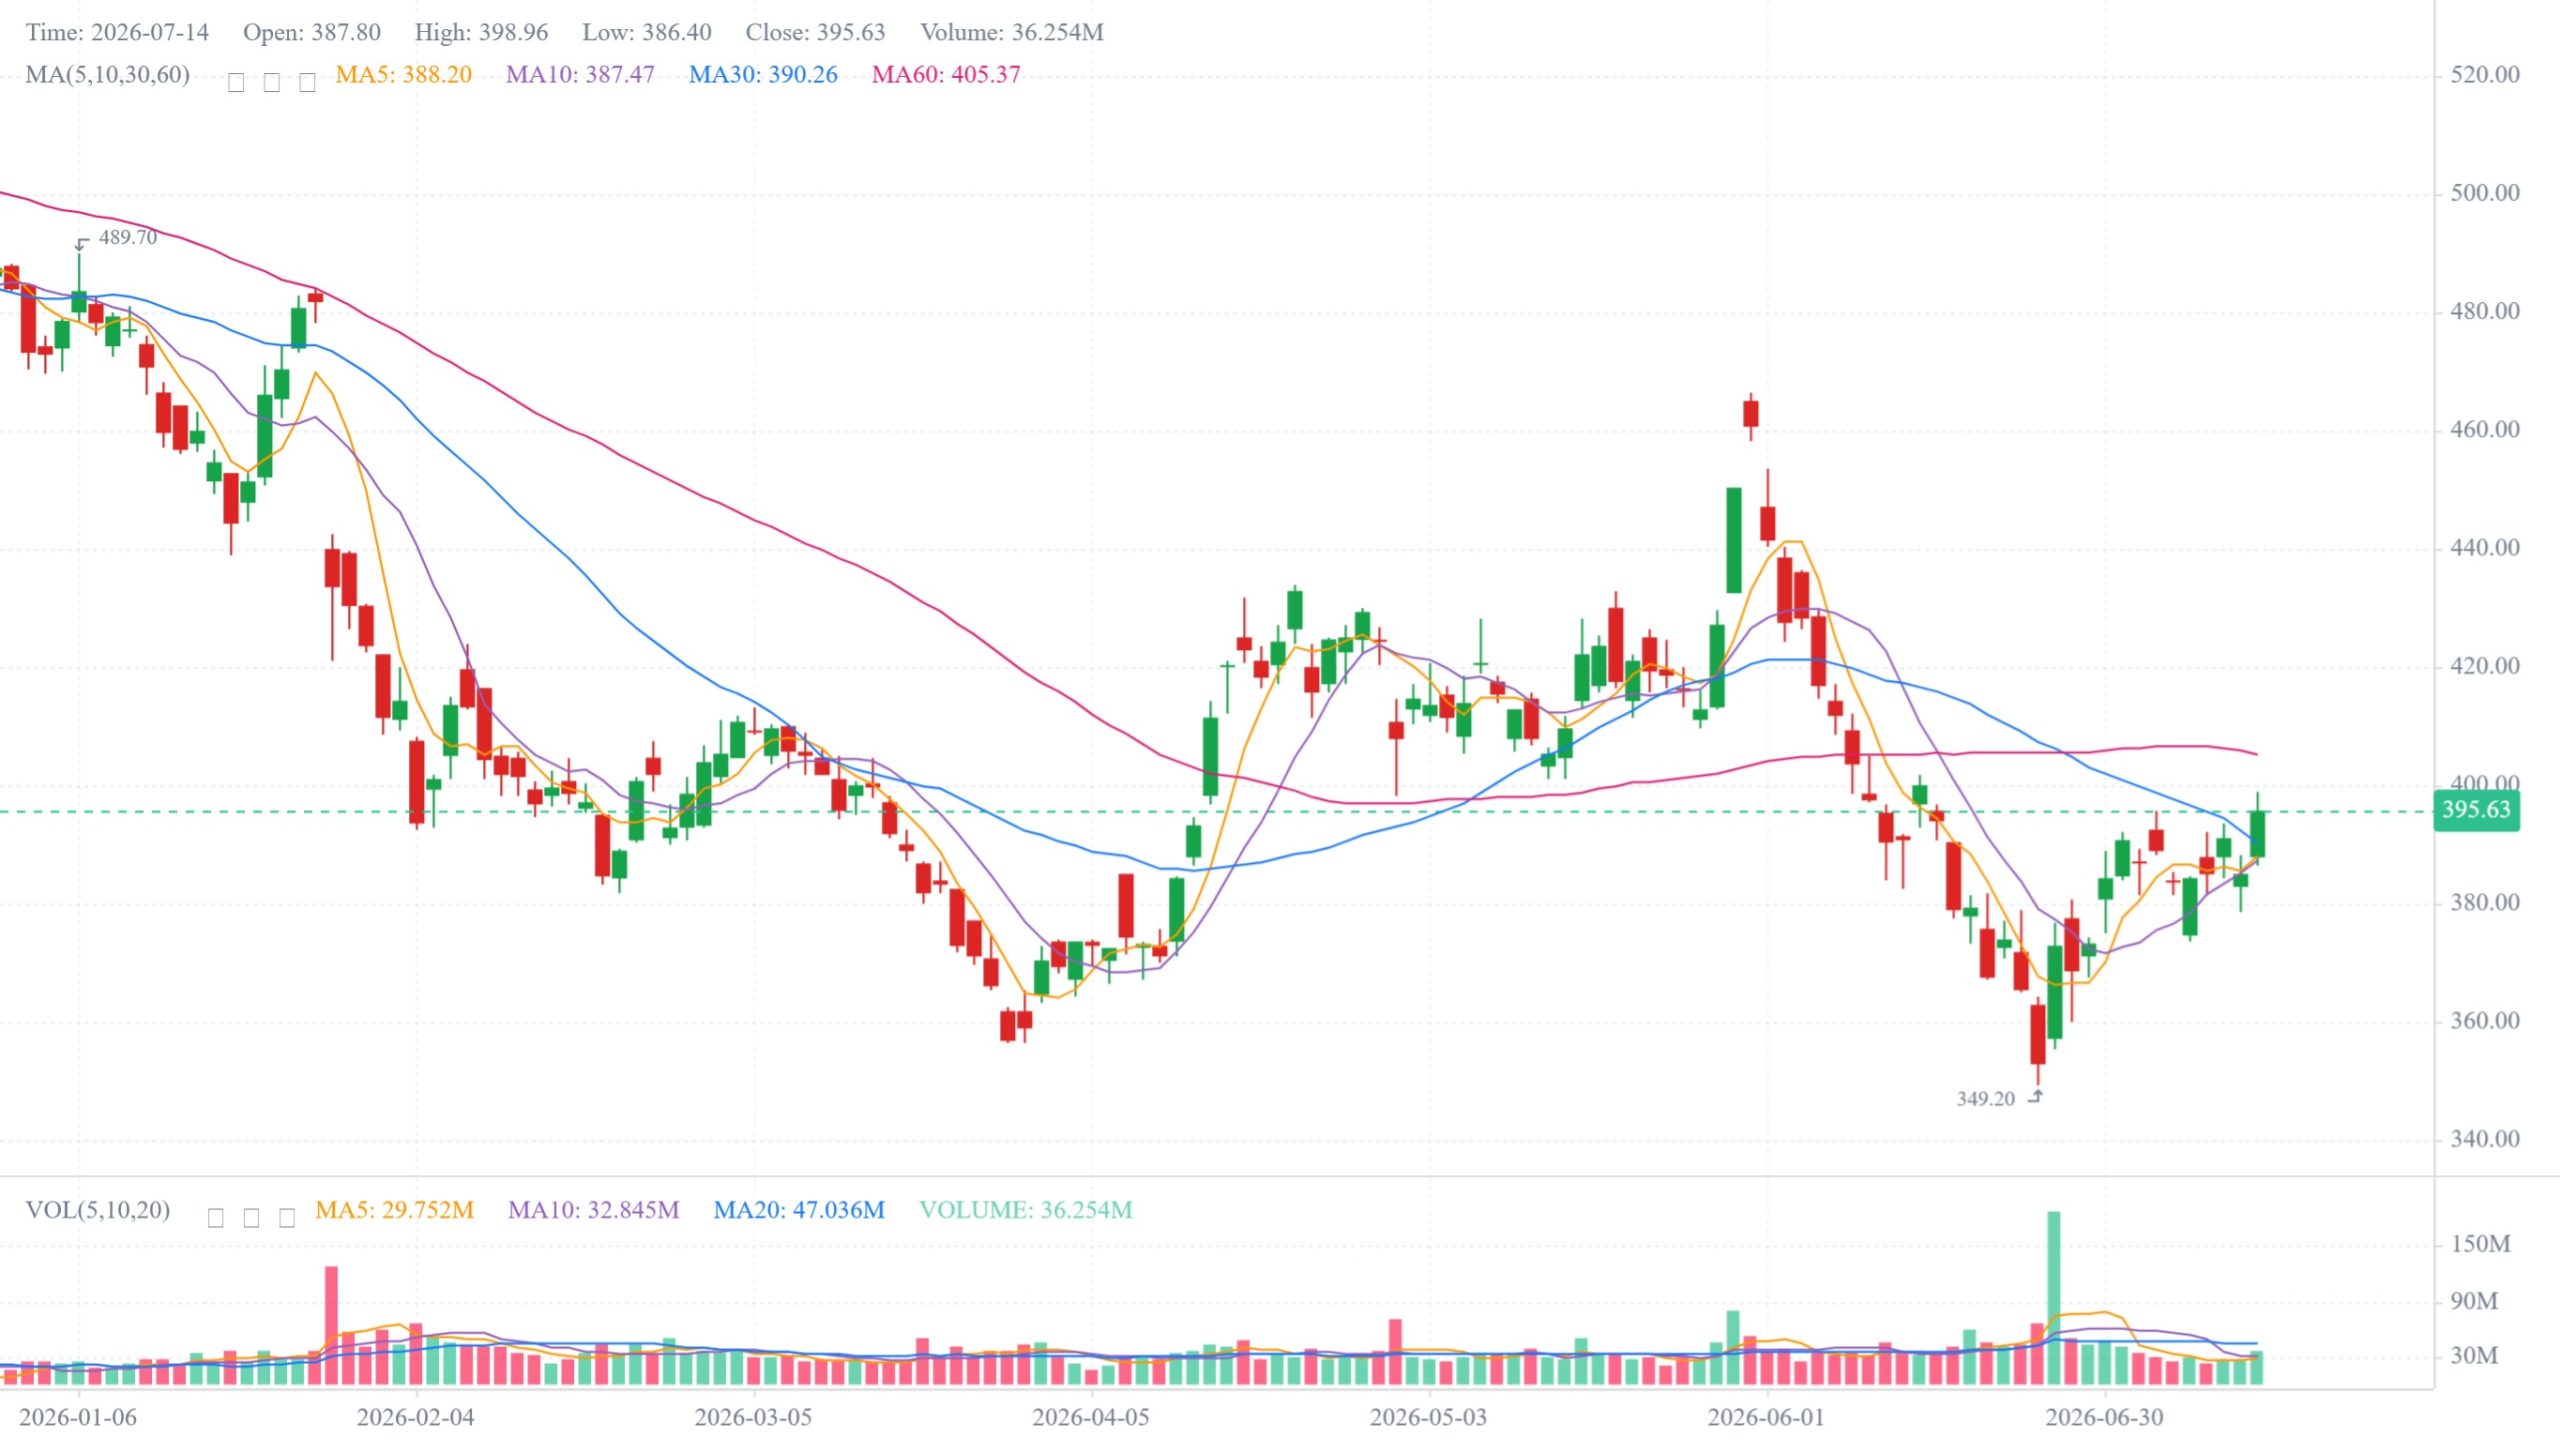
A historical stock chart can be numerically correct and still tell the wrong story. When a company completes a stock split or pays a cash distribution, the raw closing price can jump or fall for mechanical reasons that are not the same as an investment gain or loss. An adjusted price series rewrites earlier observations so returns can be compared on a consistent basis.
This guide explains raw close, adjusted close, split factors, dividend adjustments, volume adjustments, and the checks that help prevent misleading performance charts.
Raw close and adjusted close answer different questions
The raw closing price is the quoted close for that security on that date. It is useful when you need to know the historical trading price as it was displayed then. The adjusted close is designed for return analysis. It incorporates later corporate actions so observations before and after an event can be compared more consistently.
Neither series is universally “better.” The right choice depends on the question:
- Use raw prices to discuss the quoted market level on a specific historical date.
- Use split-adjusted prices to analyze price continuity across stock splits.
- Use split-and-dividend-adjusted prices to estimate total-return-like movement, subject to provider methodology.
- Label the basis so readers know which interpretation applies.
How a stock split changes the chart
In a conventional forward split, shareholders receive more shares while the price per share is reduced proportionally. Investor.gov explains that in a stock split a company increases the number of shares outstanding while lowering the share price proportionately. The aggregate economic value does not increase merely because the share count changed.
Consider a 4-for-1 split. A shareholder with one share at $400 would generally hold four shares at roughly $100 immediately after the mechanical adjustment, before market movement. A raw chart that places $400 next to $100 looks like a 75% crash. A split-adjusted chart scales the pre-split observations so the series remains continuous.
A reverse split works in the opposite direction: fewer shares and a proportionally higher per-share price. Reverse splits also require adjustment if historical percentage changes are to remain meaningful.
Why cash dividends affect adjusted prices
On the ex-dividend date, a share can trade lower by roughly the distribution amount, all else equal, because the buyer no longer receives that declared payment. A price-only series treats the lower quote as a loss. A dividend-adjusted series accounts for the cash distribution when connecting returns across the event.
The exact adjustment convention can differ by data provider, especially around special distributions, withholding, reinvestment assumptions, spin-offs, rights offerings, and late corrections. “Adjusted” is therefore a methodology label, not a universal constant. Keep provider fields and corporate-action records together so the series can be audited.
Adjusted OHLC needs a consistent factor
For candlestick charts, adjusting only the close is not enough. Open, high, low, and close should use a consistent adjustment factor for each date. Otherwise a candle can contain impossible geometry—for example, an adjusted close above an unadjusted high.
A common approach derives a daily ratio from adjusted close divided by raw close and applies it to the raw open, high, and low. Some licensed feeds directly provide adjusted open, high, low, close, and volume. Direct fields should be retained when available because they preserve the source methodology.
After adjustment, validate that:
- Low is not above open, close, or high.
- High is not below open, close, or low.
- Prices are positive where a valid bar exists.
- Dates remain unique for the ticker, provider, asset type, and frequency.
- Known split dates do not create unexplained discontinuities.
Volume also changes around splits
A split changes the number of shares represented by historical trading volume. To compare volume across the event, many adjusted datasets rescale pre-split volume in the opposite direction from price. A 4-for-1 split typically divides historical prices by four and multiplies comparable historical volume by four.
Do not derive an adjusted volume casually when the provider supplies one. Corporate actions can be complex, and a source’s adjusted fields should stay internally consistent.
Returns should use the same basis at both endpoints
A return calculation is invalid if one endpoint is raw and the other is adjusted. For daily, monthly, year-to-date, and multi-year price performance, use a consistent adjusted series. Record the dates used and handle non-trading days explicitly.
For example, a one-year return normally compares the latest eligible adjusted close with the adjusted close on or before the one-year reference date. If the security has insufficient history, say so. Do not silently shorten the period and still label it “one year.”
Adjustment does not solve every data problem
An adjusted series can still contain ticker changes, stale quotes, duplicate bars, currency issues, delisting gaps, or incorrect corporate-action records. Exchange-traded funds and mutual funds can have distributions and share events that require the same care as stocks. Newly listed securities naturally have shorter history.
Quality checks should include coverage start and end dates, the latest expected market session, null adjusted values, extreme one-day moves, and reconciliation against corporate actions. When a value fails a check, it is safer to show the raw source date and an availability notice than to interpolate a price.
Public EOD and Premium real-time prices
Historical adjustment and real-time access are separate concepts. A public visitor can receive the latest completed end-of-day close and still view a properly adjusted historical chart. An eligible Premium account may receive a live quote during supported market hours. Once the market session ends, the completed daily close becomes the stable reference.
A live ticker should not rewrite the historical adjusted series. It can overlay the current eligible quote while preserving the daily bars used for period returns. The interface should make that distinction visible with labels such as “live,” “latest close,” or an explicit as-of timestamp.
A practical chart-verification checklist
- Confirm the ticker and asset type.
- Confirm whether the chart is raw, split-adjusted, or split-and-dividend-adjusted.
- Check the latest bar date against the latest completed market session.
- Inspect known split dates for mechanical jumps.
- Verify OHLC consistency and adjusted volume where applicable.
- Ensure return endpoints use the same adjustment basis.
- Keep the source payload and fetched timestamp for audit.
How US Stock Sense applies the rule
US Stock Sense daily chart history requests the adjusted price path. The data model retains raw close, adjusted close, the provider payload, price date, and fetch timestamp. That allows the product to display an adjusted chart while preserving the source values needed to investigate a discrepancy.
A worked split-and-dividend example
Assume a share closes at $100, completes a 2-for-1 split, and then trades near $50. A split-adjusted series scales the earlier $100 observation to roughly $50. If the company also paid a $1 pre-split cash dividend before the event, a distribution-adjusted series may scale the earlier observation further so the return connection recognizes the cash received.
The calculation should come from one coherent source methodology. Applying a home-built split factor to a close that was already dividend-adjusted can double-adjust the series. Preserve the raw payload and the provider’s corporate-action fields so the transformation can be reproduced.
Ticker changes, mergers, and spin-offs
Not every discontinuity is a split. A ticker can change after a rename or reorganization. A merger can deliver cash, shares, or both. A spin-off can transfer part of the economic value into a new security. Standard adjusted-close fields may handle these events differently.
Do not automatically stitch symbols together. Confirm the legal succession and the purpose of the chart. A historical issuer study may want continuity across a ticker change; a security-level return series may need to preserve the separate instruments.
How to investigate an implausible move
- Check the raw close and adjusted close on both sides of the move.
- Inspect split factor and cash-distribution fields.
- Search the issuer’s filing record for the corporate event.
- Compare OHLC geometry and volume treatment.
- Check for ticker, exchange, or currency changes.
- Compare the same dates with another authoritative record.
- Correct the source mapping or adjustment logic; do not hand-edit one chart point without an audit trail.
Adjusted prices and financial ratios
Per-share ratios require consistent share and price treatment. A split should not change economic value, but it changes historical shares and quoted price. Data pipelines should use split-adjusted per-share series or period-appropriate share counts so a split does not create false growth or valuation movement.
Market capitalization is less mechanically affected because price and shares move in opposite directions, but timing still matters. Mixing today’s share count with an old raw price can create a value that never existed.
You can inspect a company from the stock directory, an ETF from the ETF directory, or a benchmark from the indices page. Always read the freshness label before comparing the chart with a live brokerage quote.
Bottom line
Use the raw close when the historical quote itself is the subject. Use a clearly labeled adjusted series when measuring performance across splits and distributions. Never mix bases between endpoints, and do not assume that a smooth chart proves the corporate-action record is complete. The as-of date, adjustment method, and retained source fields are part of the result.
Source
This article explains data methodology and is not investment advice. Corporate-action treatment can vary by source and security.