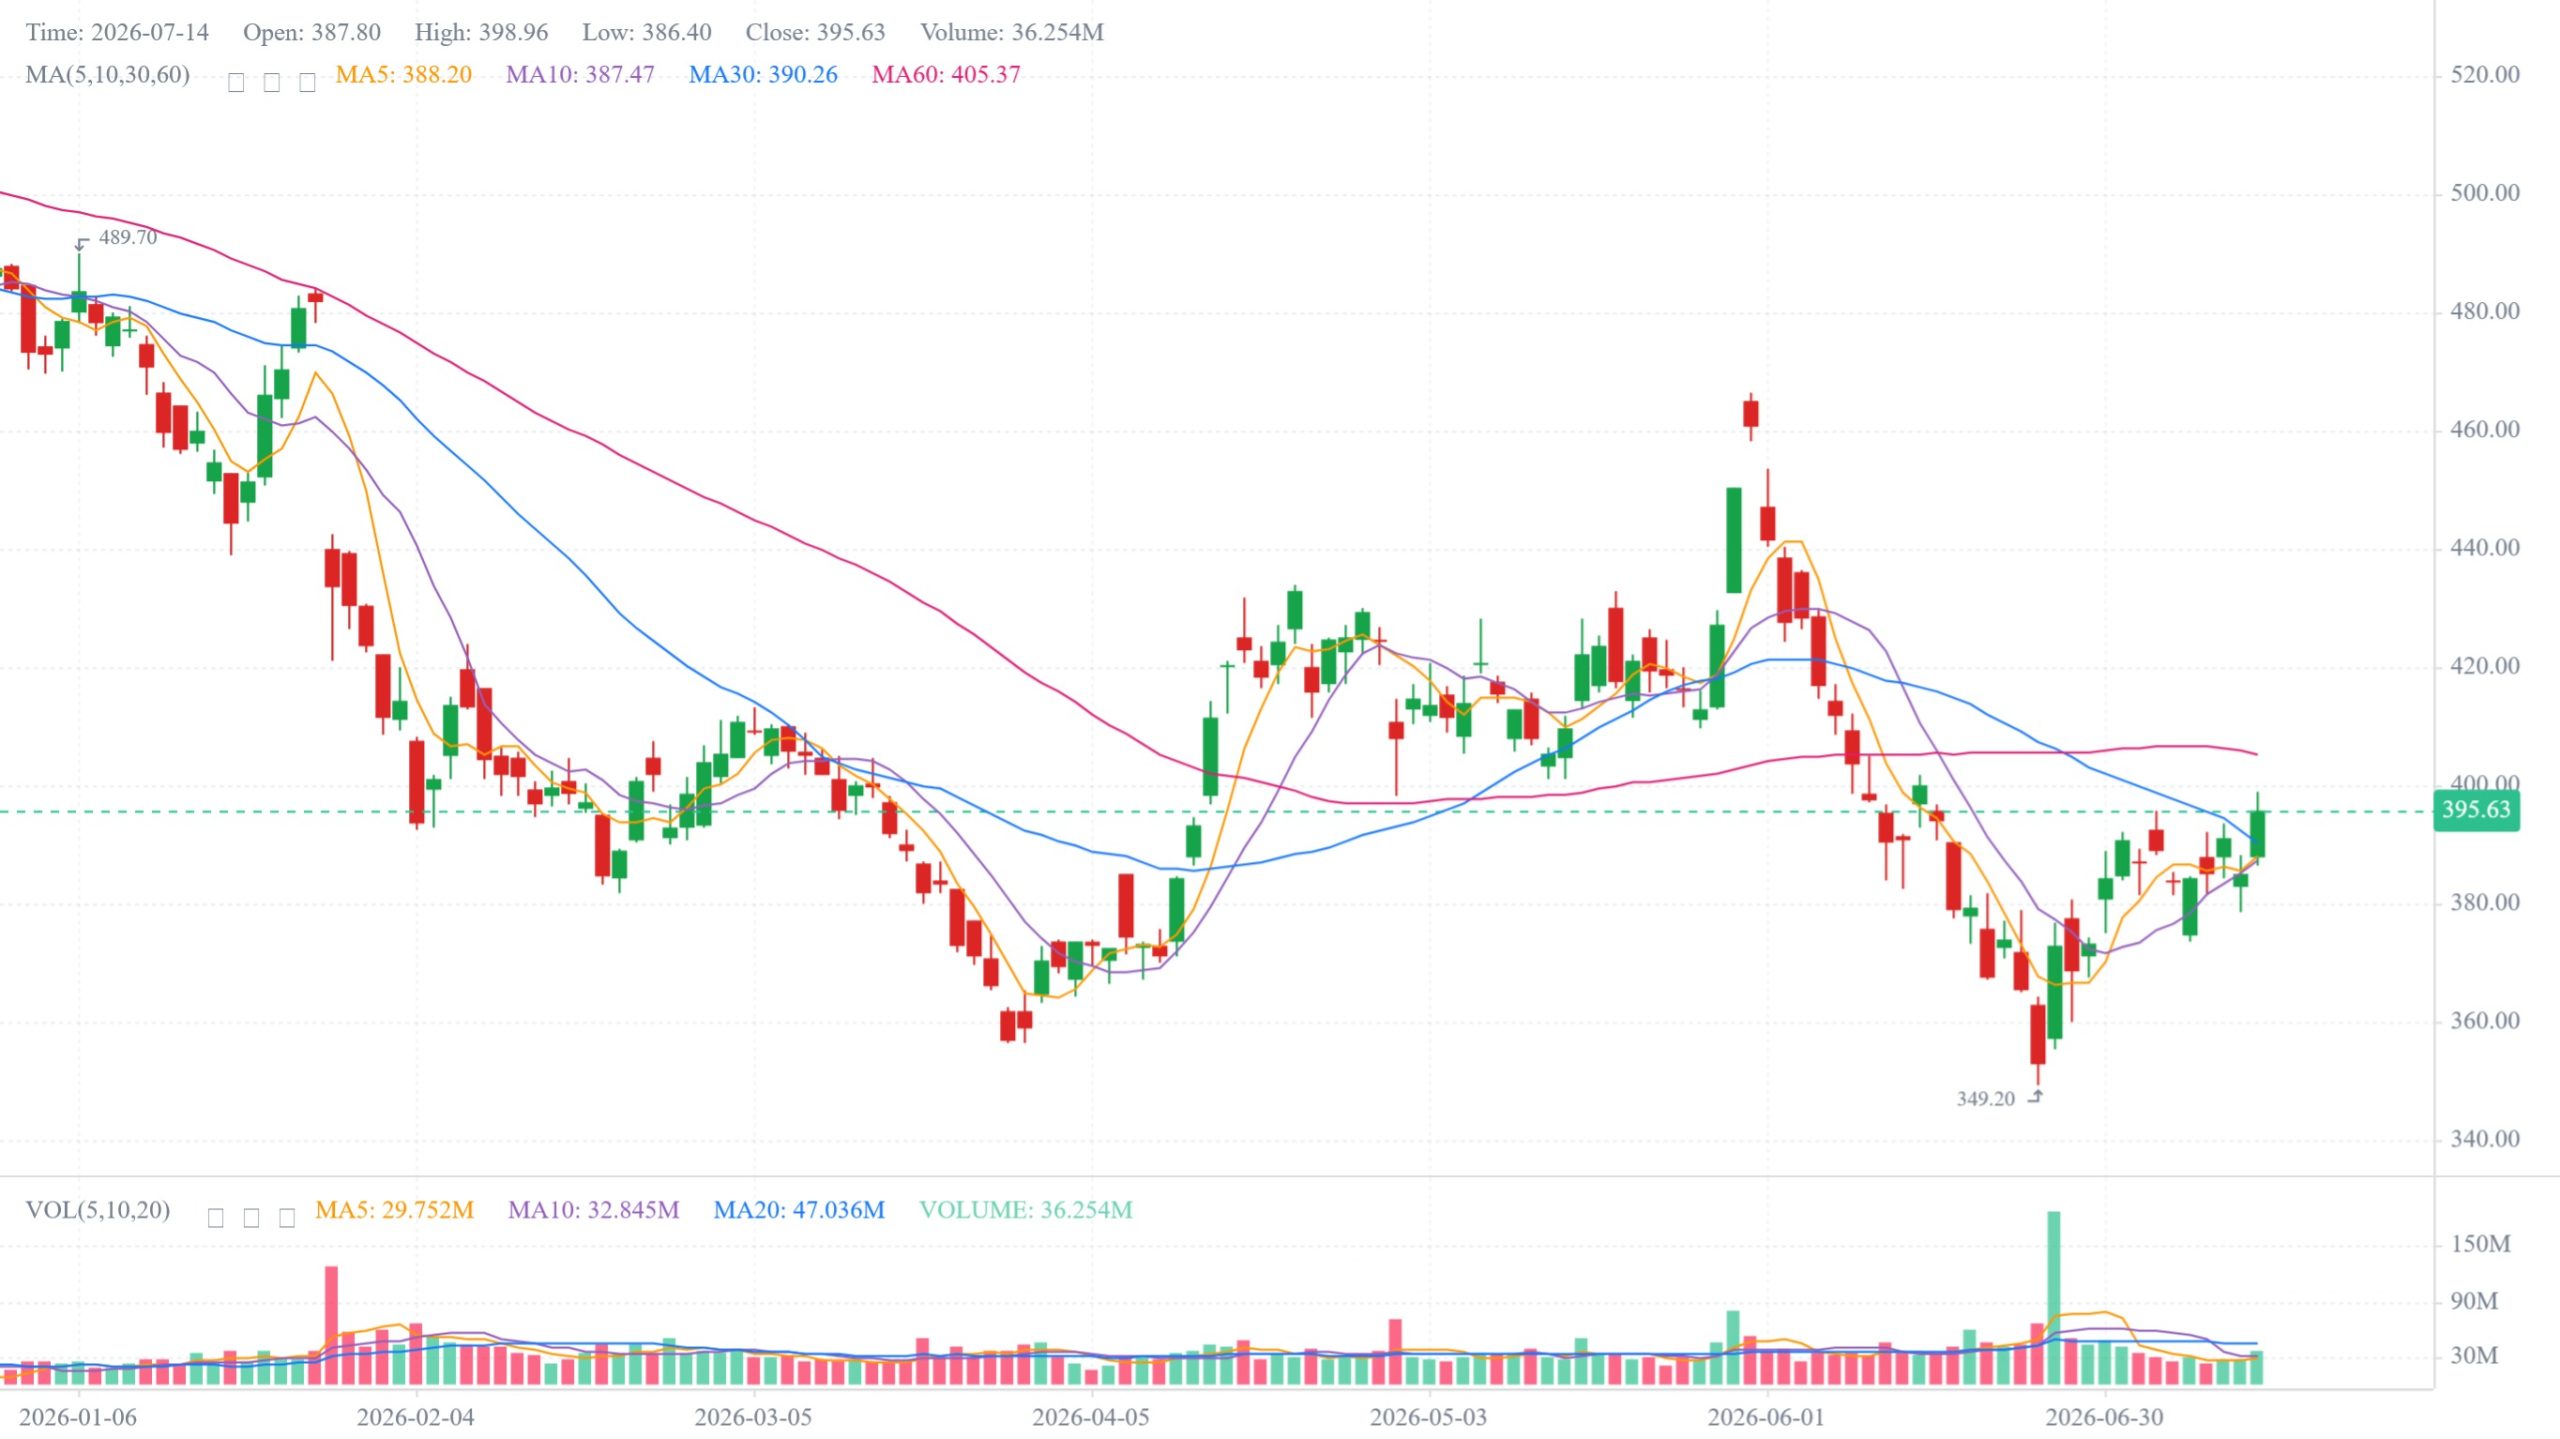
A stock screen is a rule applied to a defined universe at a defined time. A backtest asks what would have happened if that rule had been applied in the past. The answer can look precise while being badly biased if the test uses information that was not available on the historical decision date.
This guide explains point-in-time data, look-ahead bias, survivorship bias, rebalancing, transaction costs, and a practical review checklist for screening strategies.
Write the rule before looking at the result
A reproducible screen identifies its universe, fields, operators, thresholds, missing-data behavior, ranking rule, rebalance schedule, and maximum number of positions. “High-quality companies” is an idea. “US-listed operating companies with positive trailing return on invested capital above a stated threshold, ranked by free-cash-flow yield” is closer to an executable rule.
Every additional rule creates another opportunity to fit historical noise. Keep an untouched validation period and document changes to the formula.
Point-in-time means available then
Suppose a company’s fiscal year ended December 31 but its 10-K was filed in late February. A January 31 rebalance could not have used the final annual figures. A backtest that assigns those figures to the fiscal period end introduces future information.
For filing-derived metrics, the conservative availability date is tied to when the filing became public, not only the period end. Amendments and restatements add complexity: a test should generally use the version available on the decision date, while a current research page may prefer the latest corrected record.
Price data also needs a timing rule
A strategy cannot use today’s closing price to trade at that same close unless its assumptions explicitly permit and model that execution. A safer convention calculates signals after the close and applies trades at the next eligible session using a defined price.
Keep raw and adjusted prices separate. Adjusted history is appropriate for return continuity across splits and distributions, but adjustment factors can reflect later corporate actions. The implementation must ensure that the return series and execution assumptions remain internally consistent.
Survivorship bias changes the universe
Testing only companies that exist today excludes many delisted, acquired, bankrupt, or renamed securities. That can make historical results look better because failures disappear. A point-in-time universe should include securities that were eligible then, with delisting and corporate-action treatment where available.
If a dataset lacks historical membership, disclose that limitation. Do not label the result an unbiased simulation.
Missing data is not zero
A missing ratio can mean the necessary filing line was absent, the issuer type requires a different formula, the history is insufficient, or the normalization failed. Converting missing values to zero can incorrectly admit or reject a company.
Define the policy for every condition. Most numeric comparisons should exclude missing observations and report coverage. A backtest with excellent returns but 20% field coverage may be describing a narrow subset rather than the intended universe.
Rebalancing creates turnover
Daily re-ranking can produce far more trading than a monthly or quarterly process. Specify the schedule, holding period, entry and exit rules, and treatment of ties. Report turnover and the number of positions at each rebalance.
A strategy with attractive gross returns can become unattractive after spreads, commissions, slippage, taxes, and market impact. Small-cap and low-volume screens require especially conservative assumptions.
Position sizing can dominate the signal
Equal weighting, market-cap weighting, score weighting, volatility weighting, and custom sizing produce different risk. A few large positions can explain most of a backtest even when the screen selects many names.
Report concentration, sector exposure, maximum position, and the effect of caps. A strategy result is a combination of selection and portfolio construction.
Benchmarks must match the opportunity set
A US small-cap strategy compared only with a large-cap index can create a misleading narrative. Choose a benchmark that reflects the investable universe and risk profile, while recognizing that no benchmark is perfect.
Compare the same dates and return basis. If the strategy includes reinvested distributions, the benchmark should use a comparable total-return series where available.
Validate outside the design sample
Reserve a later period that was not used to select thresholds. Walk-forward testing is another approach: build the rule using information available up to a date, test the next interval, then roll forward. The key is to separate discovery from evaluation.
Also test neighboring thresholds. If performance disappears when a cutoff moves from 15% to 14% or 16%, the rule may be fragile. Economic intuition and stability matter more than finding the highest historical result.
Stress the assumptions
Run scenarios with higher transaction costs, delayed execution, fewer positions, different rebalancing frequencies, sector caps, and alternative start dates. Examine drawdowns and long periods of underperformance, not only compound return.
Risk statistics such as volatility, Sharpe ratio, Sortino ratio, or maximum drawdown summarize history; they do not guarantee future behavior. Check the underlying return path and exposure.
A pre-publication backtest checklist
- Is the screen formula fully specified and reproducible?
- Were fundamentals available by each decision date?
- Does the universe include historical failures and delistings?
- Are missing values excluded and coverage reported?
- Are execution timing and adjusted-price rules explicit?
- Are transaction costs and slippage included?
- Are turnover, concentration, and sector exposure reported?
- Was an out-of-sample or walk-forward test used?
- Were alternative assumptions and thresholds tested?
- Is the result described as hypothetical rather than predictive?
Use screen results as a research queue
A current screen is most useful as a prioritized queue. Open each match, inspect the latest filing, verify the ratio inputs, review the balance sheet and cash flow, and assess whether the business fits the rule’s intended logic.
The US Stock Sense curated screener library displays named strategies and exact conditions. Public results are bounded; saving, advanced metrics, and backtesting depend on account access. Company evidence is available through the stock directory.
What a responsible result should disclose
A backtest summary should state the date range, universe, data timing, benchmark, rebalance schedule, transaction-cost assumptions, position count, weighting method, and known coverage limitations. Charts should identify whether they show price return or adjusted total-return-like performance.
If those facts are missing, the headline return is not enough to evaluate the strategy.
A worked availability-date example
Imagine a screen rebalances on January 15, 2025 and requires fiscal-year revenue growth. Company X’s year ended December 31, 2024, but its annual filing did not become public until February 28, 2025. Using the 2024 annual figure in the January screen is look-ahead bias. The point-in-time engine should use the latest filing available by January 15, likely a quarterly record or the prior annual period.
Now imagine that the February filing is amended in April. A backtest decision in March should use the original version; a decision after the amendment may use the corrected one. A current company page can show the corrected history while the historical simulation preserves what was knowable at each date.
Multiple testing creates invisible luck
If a researcher tries hundreds of thresholds, universes, rebalance dates, and weighting methods, one combination may look excellent by chance. Reporting only the winner hides the search process. Keep an experiment log and distinguish pre-specified tests from exploratory analysis.
Prefer rules with an economic rationale, stable neighboring thresholds, and reasonable results across different periods. A strategy that depends on one start date or a few securities needs a much weaker claim.
Corporate actions and delistings must be explicit
Splits and distributions require adjusted return history. Mergers, bankruptcies, ticker changes, and delistings require an exit convention. Dropping a failed security because no current quote exists can erase losses. Carrying the last price forever can also be wrong.
Document how cash consideration, share exchanges, missing prices, and delisted securities are handled. If the dataset cannot support a case, report the limitation and test sensitivity.
Capacity matters even for a good historical signal
A small strategy may trade illiquid stocks at historical closing prices in a spreadsheet, while real orders would move the market. Estimate position size relative to average daily volume and apply conservative participation and slippage assumptions.
Capacity constraints can change over time. A current liquidity filter should not be applied retroactively using today’s volume.
Questions for every surprising equity curve
- Which securities and periods contributed most of the return?
- Does the result survive realistic costs and next-session execution?
- Were failed and delisted companies retained?
- Did any field use a later restatement?
- How much of the result comes from sector or size exposure?
- Does a nearby threshold produce a similar pattern?
- Was the validation period truly untouched?
Bottom line
A defensible screen is reproducible, and a defensible backtest respects what was knowable at each historical decision date. Point-in-time filings, historical universe membership, explicit missing-data rules, realistic execution, costs, and out-of-sample validation matter more than a polished equity curve. Document every material assumption and use results to prioritize research, not to promise performance.
Further reading
Hypothetical performance has inherent limitations and does not predict future results under changing market conditions, liquidity regimes, or transaction costs. This article is educational and does not recommend a strategy or security.